


Categories
International online shopping made easy at buydo.com


Best Seller


New Arrivals
Great value
We offer competitive prices on over 100 million items
Safe payment
Pay with the world’s most popular and secure payment methods
Shop with confidence
Our Buyer Protection policy covers your entire purchase journey
Worldwide shipping
We ship over 200 countries and regions and our site comes in 12 languages
Help center
Round the clock assistance for a smooth shopping experience
Get everything you need from Buydo
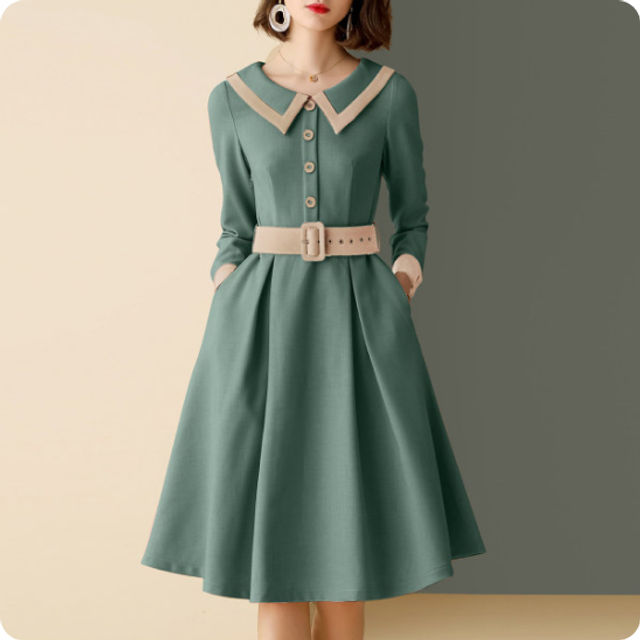
Fashion
Buydo is your one-stop-shop for all things women's fashion! We understand that shopping for clothes, dresses, and shoes can be time-consuming and frustrating, which is why we've made it easy for you to find everything you need in one place. Our online store offers a vast selection of women's clothing items, including dresses, tops, pants, and more, in various styles and sizes. We also carry a wide range of shoes, from trendy sneakers to elegant heels. With competitive pricing and frequent sales, you're sure to find something you love on our website. Shop now at buydo.com and elevate your wardrobe today!
Fitness & Sports
Our online store features a vast collection of products, from workout equipment and accessories to activewear and sports shoes, ensuring that you find everything you need to stay active and healthy. We offer competitive prices, a hassle-free shopping experience, and prompt shipping, so you can focus on what really matters – achieving your fitness goals.
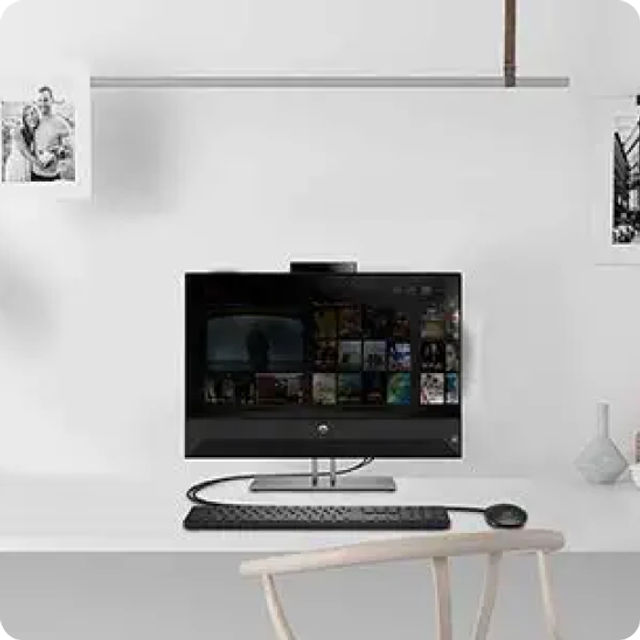
Mobile & Accessories
Looking for the latest gadgets, mobile accessories, phone cases, and chargers? Look no further than buydo.com! Our online store offers a wide range of electronic products and accessories to help you stay connected on-the-go. With an extensive collection of mobile products, including phone cases, chargers, power banks, and more, you're sure to find what you're looking for on our website. With competitive prices and prompt shipping, shopping at buydo.com is a hassle-free experience. So why wait? Browse our selection today and take your mobile experience to the next level!
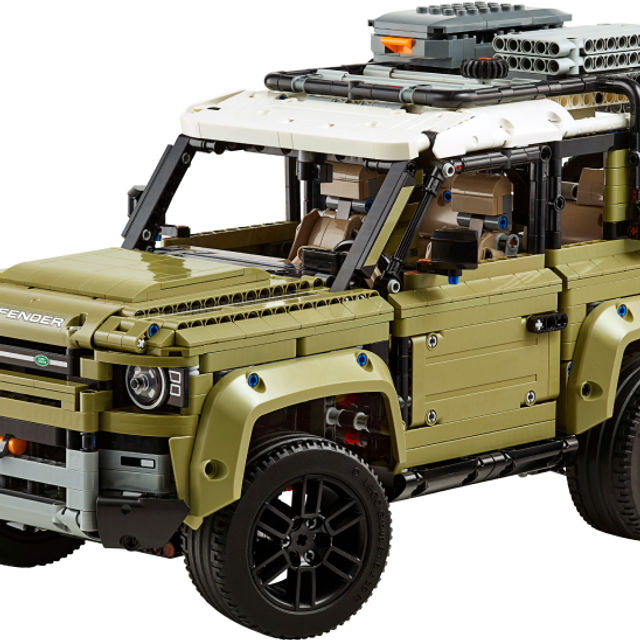
Toys & Hobbies
Buydo is your ultimate destination for toys and hobby items for kids and adults alike! Our online store features a wide variety of toys, including remote-controlled cars, airplanes, drones, and more, to keep both children and hobbyists entertained for hours. Whether you're looking for a fun gift or a new hobby, you're sure to find what you're looking for on our website. Browse our selection today and let the fun begin!
Beauty & Personal Care
Whether you're looking to update your skincare routine, try out new makeup trends, or pamper yourself with luxurious bath and body products, you're sure to find what you need on our website. Browse our selection today and let us help you look and feel your best!